Dynamic chart
A dynamic chart range is a data range that updates automatically when you change the data source.This dynamic range is then used as the source data in a chart. As the data changes, the dynamic range updates instantly which leads to an update in the chart.
follow the steps
1.
Click the Insert tab.
2.
In the Tables group,
click Table.
3.
Excel will display the
selected range, which you can change. If the table does not have
headers, be sure to uncheck the My Table Has Headers option.
4.
Click OK and Excel
will format the data range as a table.

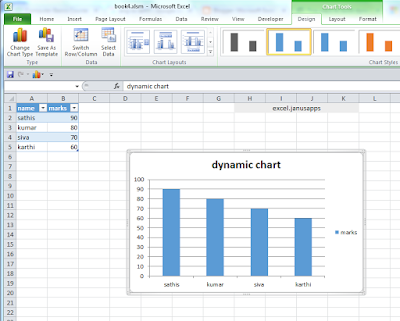


Any chart you build on
the table will be dynamic. To illustrate, create a quick column chart as
follows:
1.
Select the table.
2.
Click the Insert tab.
3.
In the Charts group,
choose the first 2-D column chart in the Chart drop down.

Now, update the chart
by adding values for March and watch the chart update automatically.


No comments:
Post a Comment