Database function
Averages the values in a field (column) of records in a list or database that match conditions you specify.
syntax
DAVERAGE(database, field, criteria)

parameters
Database
is the range of cells that makes up the list or database. A database is a list of related data in which rows of related information are records, and columns of data are fields. The first row of the list contains labels for each column.
Field
indicates which column is used in the function. Enter the column label enclosed between double quotation marks, such as "quantity" or "quantity rate" or a number (without quotation marks) that represents the position of the column within the list: 1 for the first column, 2 for the second column, and so on.
Criteria
is the range of cells that contains the conditions you specify. You can use any range for the criteria argument, as long as it includes at least one column label and at least one cell below the column label in which you specify a condition for the column.

Dcount function
Counts the cells that contain numbers in a field (column) of records in a list or database that match conditions that you specify.
syntax
DCOUNT(database, field, criteria)

parameters
Database
is the range of cells that makes up the list or database. A database is a list of related data in which rows of related information are records, and columns of data are fields. The first row of the list contains labels for each column.
Field
indicates which column is used in the function. Enter the column label enclosed between double quotation marks, such as "quantity" or "quantity rate" or a number (without quotation marks) that represents the position of the column within the list: 1 for the first column, 2 for the second column, and so on.
Criteria
is the range of cells that contains the conditions you specify. You can use any range for the criteria argument, as long as it includes at least one column label and at least one cell below the column label in which you specify a condition for the column.

Dcounta function
Counts the non blank cells in a field (column) of records in a list or database that match conditions that you specify.The field argument is optional. If field is omitted, DCOUNTA counts all records in the database that match the criteria.
syntax
DCOUNTA(database, field, criteria)

parameters
Database
is the range of cells that makes up the list or database. A database is a list of related data in which rows of related information are records, and columns of data are fields. The first row of the list contains labels for each column.
Field
indicates which column is used in the function. Enter the column label enclosed between double quotation marks, such as "quantity" or "quantity rate" or a number (without quotation marks) that represents the position of the column within the list: 1 for the first column, 2 for the second column, and so on.
Criteria
is the range of cells that contains the conditions you specify. You can use any range for the criteria argument, as long as it includes at least one column label and at least one cell below the column label in which you specify a condition for the column.

Dget function
Extracts a single value from a column of a list or database that matches conditions that you specify.
syntax
DGET(database, field, criteria)

parameters
Database
is the range of cells that makes up the list or database. A database is a list of related data in which rows of related information are records, and columns of data are fields. The first row of the list contains labels for each column.
Field
indicates which column is used in the function. Enter the column label enclosed between double quotation marks, such as "quantity" or "quantity rate" or a number (without quotation marks) that represents the position of the column within the list: 1 for the first column, 2 for the second column, and so on.
Criteria
is the range of cells that contains the conditions you specify. You can use any range for the criteria argument, as long as it includes at least one column label and at least one cell below the column label in which you specify a condition for the column.

Dmax function
Returns the largest number in a field (column) of records in a list or database that matches conditions you that specify.
syntax
DMAX(database, field, criteria)

parameters
Database
is the range of cells that makes up the list or database. A database is a list of related data in which rows of related information are records, and columns of data are fields. The first row of the list contains labels for each column.
Field
indicates which column is used in the function. Enter the column label enclosed between double quotation marks, such as "quantity" or "quantity rate" or a number (without quotation marks) that represents the position of the column within the list: 1 for the first column, 2 for the second column, and so on.
Criteria
is the range of cells that contains the conditions you specify. You can use any range for the criteria argument, as long as it includes at least one column label and at least one cell below the column label in which you specify a condition for the column.

Dmin function
Returns the smallest number in a field (column) of records in a list or database that matches conditions that you specify.
syntax
DMIN(database, field, criteria)

parameters
Database
is the range of cells that makes up the list or database. A database is a list of related data in which rows of related information are records, and columns of data are fields. The first row of the list contains labels for each column.
Field
indicates which column is used in the function. Enter the column label enclosed between double quotation marks, such as "quantity" or "quantity rate" or a number (without quotation marks) that represents the position of the column within the list: 1 for the first column, 2 for the second column, and so on.
Criteria
is the range of cells that contains the conditions you specify. You can use any range for the criteria argument, as long as it includes at least one column label and at least one cell below the column label in which you specify a condition for the column.

Dproduct function
Multiplies the values in a field (column) of records in a list or database that match conditions that you specify.
syntax
DPRODUCT(database, field, criteria)

parameters
Database
is the range of cells that makes up the list or database. A database is a list of related data in which rows of related information are records, and columns of data are fields. The first row of the list contains labels for each column.
Field
indicates which column is used in the function. Enter the column label enclosed between double quotation marks, such as "quantity" or "quantity rate" or a number (without quotation marks) that represents the position of the column within the list: 1 for the first column, 2 for the second column, and so on.
Criteria
is the range of cells that contains the conditions you specify. You can use any range for the criteria argument, as long as it includes at least one column label and at least one cell below the column label in which you specify a condition for the column.

Dstdev function
Estimates the standard deviation of a population based on a sample by using the numbers in a field (column) of records in a list or database that match conditions that you specify.
syntax
DSTDEV(database, field, criteria)

parameters
Database
is the range of cells that makes up the list or database. A database is a list of related data in which rows of related information are records, and columns of data are fields. The first row of the list contains labels for each column.
Field
indicates which column is used in the function. Enter the column label enclosed between double quotation marks, such as "quantity" or "quantity rate" or a number (without quotation marks) that represents the position of the column within the list: 1 for the first column, 2 for the second column, and so on.
Criteria
is the range of cells that contains the conditions you specify. You can use any range for the criteria argument, as long as it includes at least one column label and at least one cell below the column label in which you specify a condition for the column.

Dstdevp function
Calculates the standard deviation of a population based on the entire population by using the numbers in a field (column) of records in a list or database that match conditions that you specify.
syntax
DSTDEVP(database, field, criteria)

parameters
Database
is the range of cells that makes up the list or database. A database is a list of related data in which rows of related information are records, and columns of data are fields. The first row of the list contains labels for each column.
Field
indicates which column is used in the function. Enter the column label enclosed between double quotation marks, such as "quantity" or "quantity rate" or a number (without quotation marks) that represents the position of the column within the list: 1 for the first column, 2 for the second column, and so on.
Criteria
is the range of cells that contains the conditions you specify. You can use any range for the criteria argument, as long as it includes at least one column label and at least one cell below the column label in which you specify a condition for the column.

Dsum function
Adds the numbers in a field (column) of records in a list or database that match conditions that you specify.
syntax
DSUM(database, field, criteria)

parameters
Database
is the range of cells that makes up the list or database. A database is a list of related data in which rows of related information are records, and columns of data are fields. The first row of the list contains labels for each column.
Field
indicates which column is used in the function. Enter the column label enclosed between double quotation marks, such as "quantity" or "quantity rate" or a number (without quotation marks) that represents the position of the column within the list: 1 for the first column, 2 for the second column, and so on.
Criteria
is the range of cells that contains the conditions you specify. You can use any range for the criteria argument, as long as it includes at least one column label and at least one cell below the column label in which you specify a condition for the column.

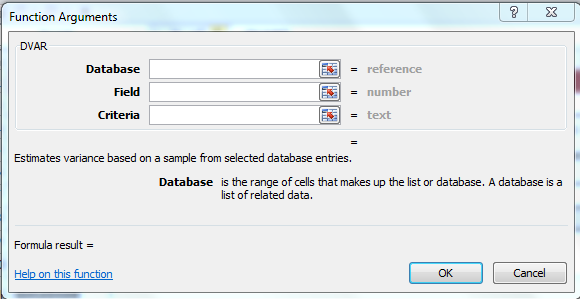
Dvar function
Estimates the variance of a population based on a sample by using the numbers in a field (column) of records in a list or database that match conditions that you specify.
syntax
DVAR(database, field, criteria)
parameters
Database
is the range of cells that makes up the list or database. A database is a list of related data in which rows of related information are records, and columns of data are fields. The first row of the list contains labels for each column.
Field
indicates which column is used in the function. Enter the column label enclosed between double quotation marks, such as "quantity" or "quantity rate" or a number (without quotation marks) that represents the position of the column within the list: 1 for the first column, 2 for the second column, and so on.
Criteria
is the range of cells that contains the conditions you specify. You can use any range for the criteria argument, as long as it includes at least one column label and at least one cell below the column label in which you specify a condition for the column.

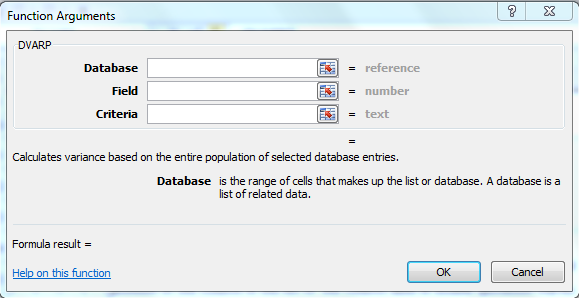
Dvarp function
Calculates the variance of a population based on the entire population by using the numbers in a field (column) of records in a list or database that match conditions that you specify.
syntax
DVARP(database, field, criteria)
parameters
Database
is the range of cells that makes up the list or database. A database is a list of related data in which rows of related information are records, and columns of data are fields. The first row of the list contains labels for each column.
Field
indicates which column is used in the function. Enter the column label enclosed between double quotation marks, such as "quantity" or "quantity rate" or a number (without quotation marks) that represents the position of the column within the list: 1 for the first column, 2 for the second column, and so on.
Criteria
is the range of cells that contains the conditions you specify. You can use any range for the criteria argument, as long as it includes at least one column label and at least one cell below the column label in which you specify a condition for the column.


